Standard Deviation: In statistics, we use the standard deviation as a quantitative measure
To find the degree of variability or spread within a provided dataset.
This metric offers valuable insights into the extent to which individual data points deviate from the central mean or average.
As the variability or dispersion in the data increases, the standard deviation value proportionally rises.
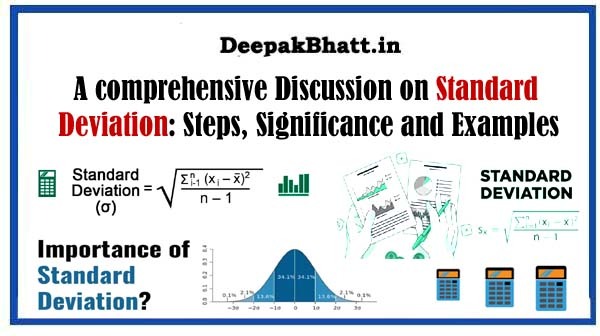
The standard deviation often denoted as SD or symbolized by the Greek letter sigma (σ) in mathematical notation; serves as a key tool in statistical analysis.
It provides information about the distribution pattern of data points around the mean, explaining the overall consistency or divergence within the dataset.
Moreover, when confronting a population dataset; the standard deviation is symbolically represented as σ, distinguishing it from the sample standard deviation denoted as s. In this article; we will discuss Standard deviation, way of calculation with examples, and key steps to understand thoroughly.
What is Standard Deviation?

Standard Deviation is the method that tells how much variation or dispersion in the data set exists from the mean or average. In the field of descriptive statistics, standard deviation serves as a key indicator of the extent to which data points deviate or scatter around their mean.
It functions as a measure of dispersion, providing valuable insights into how values are distributed within a given dataset. Essentially, standard deviation quantifies the variation of data points in relation to the mean, offering a comprehensive view of the dataset’s spread.
Measuring steps for the standard deviation of ungrouped data.
Below are a few steps for calculating standard deviation of ungrouped data.
- Collect all of the given data points for which the population standard deviation is to be calculated.
- Sum all of the data points and divide the total number of data points to get the mean.
- Find out the deviations by subtracting the mean from each data point.
- Square the deviations: In the previous step, square each deviation provided. This is done to highlight the differences while removing the negative signs.
- Take the sum of all of the squared deviations of the previous step.
- Divide the number of data points by the sum of squared deviations.
A standard deviation calculator can be a handy tool for finding standard deviation of ungrouped data according to the above-discussed steps.
Measuring steps for finding the standard deviation of continuous frequency distribution.
Below are a few steps for calculating standard deviation of grouped data.
- First, we will find the midpoints for each class.
- To get the product, multiply each midpoint by its corresponding frequency.
- Add the numbers together.
- Evaluate the mean by dividing the total frequency by the sum of the products.
- Subtract the mean from each midpoint to calculate the deviation for each.
- Square each difference.
- Take the product of each squared deviation by the frequency it corresponds to.
- Take the sum of all the squared and weighted deviations.
- Divide the frequency by the sum of the squared and weighted deviations.
- Compute the square root of the answer from the previous step.
Examples Section
Example 1: In the town, a cellular company publishes the usage of cellular data in GB (Gigabytes) of 31 houses are given as below
73,75,58,57,86,76,47,66,53,52,43,55,37,32,87,38,78,47,84,78,43,84,99,24,23,36,67,38,84,46,55
Solution:
Here,
n (number of terms) = 31
| X | X2 |
| 73 | 732 |
| 75 | 752 |
| 58 | 582 |
| 57 | 572 |
| 86 | 862 |
| 76 | 762 |
| 47 | 472 |
| 66 | 662 |
| 53 | 532 |
| 52 | 522 |
| 43 | 432 |
| 55 | 552 |
| 37 | 372 |
| 32 | 322 |
| 87 | 872 |
| 38 | 382 |
| 78 | 782 |
| 47 | 472 |
| 84 | 842 |
| 78 | 782 |
| 43 | 432 |
| 84 | 842 |
| 99 | 992 |
| 24 | 242 |
| 23 | 232 |
| 36 | 362 |
| 67 | 672 |
| 38 | 382 |
| 84 | 842 |
| 46 | 462 |
| 55 | 552 |
| ∑X= 1821 | ∑X2= 119767 |
S.D = √[(∑X2/n) – (∑X/n)2]
S.D = √ [119767/31 – (1821/31)2]
S.D = √ (3863.45 – 3450.61)
S.D = √412.84
S.D = 20.31
Example 2: Compute SD for the following:
| Classes | 1-10 | 11-20 | 21-30 | 31-40 | 41-50 |
| Frequency | 3 | 6 | 4 | 8 | 1 |
Solution
| Classes | Frequency | X | X2 | FX | FX2 |
| 1-10 | 3 | 5.5 | 30.25 | 16.5 | 90.75 |
| 11-20 | 6 | 15.5 | 240.25 | 93 | 1441.5 |
| 21-30 | 4 | 25.5 | 650.25 | 102 | 2601 |
| 31-40 | 8 | 35.5 | 1260.25 | 284 | 10082 |
| 41-50 | 1 | 45.5 | 2070.25 | 45.5 | 2070.25 |
| ∑ F= 22 | ∑FX = 541 | ∑ FX2 =16285.5 |
σ = √ [(∑FX2/∑F) – (∑FX/∑F)2]
σ = √ [(16285.5/22) – (541/22)2]
σ = √ [740.25 –604.63]
σ = √135.54
σ = 11.64
Significance of Standard Deviation
As a statistical tool for estimating the degree of variability or dispersion within a dataset, the standard deviation is highly significant.
It is widely used in many different domains and is essential to risk assessment in finance, industrial quality control, educational assessments, medical research, psychological evaluations, sports analytics, market research, and climate studies.
The standard deviation helps decision-makers across a range of disciplines by giving important insights into the consistency or volatility of data by giving a numerical depiction of how data points spread about the mean.
Its usefulness stems from its capacity to concisely convey the subtle patterns of variability, enabling a more profound comprehension of datasets and providing guidance for strategies in a variety of industries, including banking and education.
In practical terms, standard deviation is a helpful tool for understanding the diversity and distribution of values within a sample. It summarizes the concept of how far individual data points typically away from the central mean.
Technically, the standard deviation is the square root of the variance, whether applied to a data set, sample, statistical population, random variable, or probability distribution.
This mathematical relationship underscores the key role of standard deviation in capturing the important patterns of variability within diverse datasets and statistical problems.
Overview
In this section; we have discussed the concept of standard deviation in detail, covering it in all aspects to understand precisely.
Moreover, its measuring steps for both group and ungroup data will provide a helping hand to solve all kinds of problems in different directions.
Examples of each kind of provided data will improve understanding quickly. After taking into mind the whole concept, anyone can solve all problems related to statistical computations.