What is Sharpe Ratio developed by Nobel laureate William F. Sharpe, is a key metric in the world of investment that aids in precisely that.
- 1 What is Sharpe Ratio?
- 1.1 1. Essence of the Sharpe Ratio:
- 1.2 2. The Risk-Return Tradeoff:
- 1.3 II. Components
- 1.4 1. Expected Portfolio Return:
- 1.5 2. Standard Deviation of Portfolio Returns:
- 1.6 3. Formula:
- 1.7 III. Interpreting
- 1.8 1. Positive :
- 1.9 2. Zero :
- 1.10 3. Negative :
- 1.11 IV. Applications
- 1.12 1. Portfolio Comparison:
- 1.13 2. Investment Decision-Making:
- 1.14 3. Performance Evaluation:
- 1.15 V. Criticisms and Limitations
- 1.16 1. Dependency on Historical Data:
- 1.17 2. Single Metric Evaluation:
- 1.18 VI. Evolving Approaches:
- 1.19 1. Modified Sharpe Ratios:
- 1.20 2. Use of Machine Learning:
- 1.21 VII. Conclusion: Navigating the Seas of Risk and Return
What is Sharpe Ratio?
This blog post aims to demystify the Sharpe Ratio, shedding light on its components, calculations, and its significance in evaluating risk-adjusted returns.
Mastering React : The Comprehensive
Cyber Security Course : Hackers Exposed! 87%
Capital Asset Pricing Model (CAPM) Complete Guide
What is Income? Defination, Types & Concept
1. Essence of the Sharpe Ratio:
The Sharpe Ratio is a measure of risk-adjusted return, providing investors with insights into how much excess return an investment generates for the level of risk it carries.
Named after its creator, William F. Sharpe, the ratio is widely used to assess the attractiveness of an investment or a portfolio.
2. The Risk-Return Tradeoff:
At its core, the Sharpe Ratio encapsulates the fundamental principle of the risk-return tradeoff. [What is Sharpe Ratio] It acknowledges that, generally, investors expect higher returns for taking on additional risk. However, the key question is whether the returns adequately compensate for the level of risk undertaken.
II. Components
1. Expected Portfolio Return:
The numerator of the Sharpe Ratio is the difference between the expected portfolio return and the risk-free rate.
This represents the excess return generated by the investment, beyond what could be obtained from a risk-free investment.
2. Standard Deviation of Portfolio Returns:
The denominator consists of the standard deviation of the portfolio’s returns, which measures the volatility or risk associated with the investment.
A higher standard deviation indicates a greater degree of fluctuation in returns, signifying higher risk.
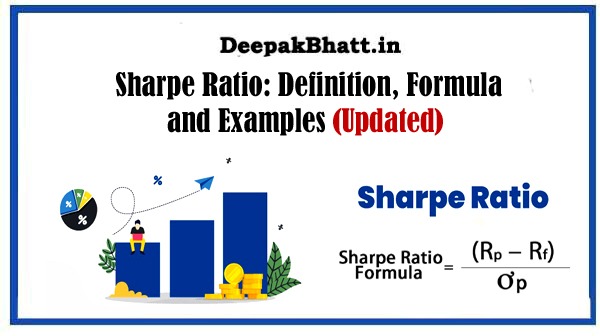
3. Formula:
The Sharpe Ratio is calculated using the following formula:
Sharpe Ratio= Rp−Rf/σp
Where:
- Rp is the expected portfolio return.
- Rf is the risk-free rate.
- σp is the standard deviation of the portfolio’s returns.
The result is a ratio that quantifies the excess return per unit of risk.
III. Interpreting
1. Positive :
A positive Sharpe Ratio indicates that the portfolio is generating excess returns above the risk-free rate for the level of risk undertaken.
The higher the ratio, the better the risk-adjusted performance.
2. Zero :
A Sharpe Ratio of zero suggests that the portfolio is not delivering excess returns compared to the risk-free rate.
Investors might question the attractiveness of such an investment, considering that they could achieve a similar return with a risk-free investment.
3. Negative :
A negative Sharpe Ratio implies that the portfolio is not adequately compensating investors for the level of risk undertaken.
In such cases, investors might reassess the risk-return dynamics of the investment.
IV. Applications
1. Portfolio Comparison:
The Sharpe Ratio is a powerful tool for comparing the risk-adjusted performance of different portfolios.
Investors can use the ratio to evaluate which portfolio is providing a better balance between risk and return.
2. Investment Decision-Making:
Investors can use the Sharpe Ratio to make informed decisions about including or excluding specific investments in their portfolios.
It aids in identifying investments that offer a better risk-adjusted return.
3. Performance Evaluation:
Fund managers and investment professionals use the Sharpe Ratio to assess the performance of mutual funds, hedge funds, or other investment vehicles. [What is Sharpe Ratio] It provides a standardized metric for evaluating how well a fund has performed relative to its risk.
V. Criticisms and Limitations
1. Dependency on Historical Data:
The Sharpe Ratio relies on historical data for calculating expected returns and standard deviations. [What is Sharpe Ratio] This dependence on past performance might not accurately reflect future market conditions.
2. Single Metric Evaluation:
Critics argue that relying solely on the Sharpe Ratio for investment decisions might oversimplify the evaluation process. Investors should consider multiple metrics and qualitative factors when making decisions.
VI. Evolving Approaches:
1. Modified Sharpe Ratios:
Modified versions of the Sharpe Ratio incorporate additional risk factors or alternative measures of risk, providing a more nuanced assessment. Examples include the Sortino Ratio, which focuses on downside risk, and the Treynor Ratio, which uses beta as a measure of risk.
2. Use of Machine Learning:
With advancements in technology, machine learning algorithms are being applied to enhance risk assessment. These approaches go beyond traditional metrics and consider a broader range of factors to predict future performance.
In conclusion, stands as a valuable tool in the toolkit of investors and financial professionals, offering a clear and quantitative measure of risk-adjusted returns.
While not without its criticisms and limitations, the Sharpe Ratio remains a widely used and respected metric for evaluating investment performance.